Venn Diagram - Previous Year CUET Questions
You can practice all previous year CUET questions from the topic Venn Diagram. This will help you understand the type of questions asked in CUET. It would be best if you clear your concepts before you practice previous year CUET questions.
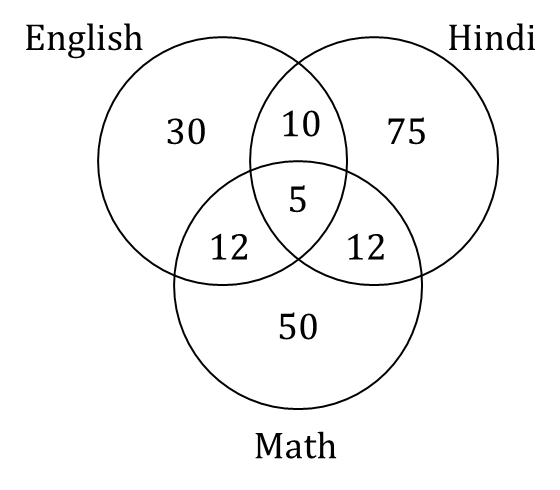
Consider the Diagram.
500 Candidates appeared in an Examination comprising test in English, Hindi and Maths. The Diagram gives number of students who failed in different tests. What is the % percentage of student who failed at least two subjects?
- A.
6.8%
- B.
7.8%
- C.
1.0%
- D.
0.078%
Answer: Option B
Explanation :
Workspace:
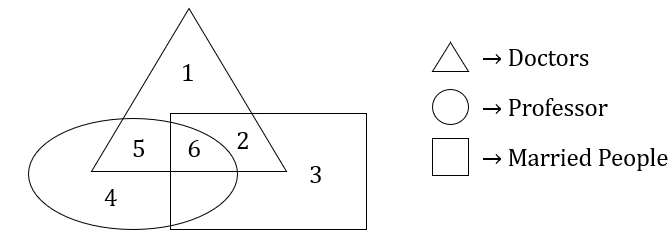
In the given figure, find out how many doctors are not married?
- A.
2
- B.
4
- C.
1
- D.
6
Answer: Option D
Explanation :
Workspace:
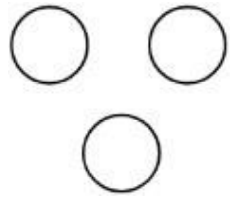
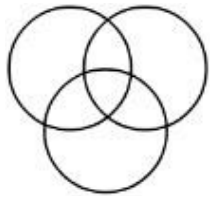
Which is the best diagram, showing the relation among Father, Mother and family.
- A.

- B.
- C.
- D.

Answer: Option D
Explanation :
Workspace:
Feedback
Help us build a Free and Comprehensive Preparation portal for various competitive exams by providing us your valuable feedback about Apti4All and how it can be improved.
 Solution
 Ask Your Doubt
 Report