IIFT 2009 LRDI | Previous Year IIFT Paper
Answer the questions based on the following graph.
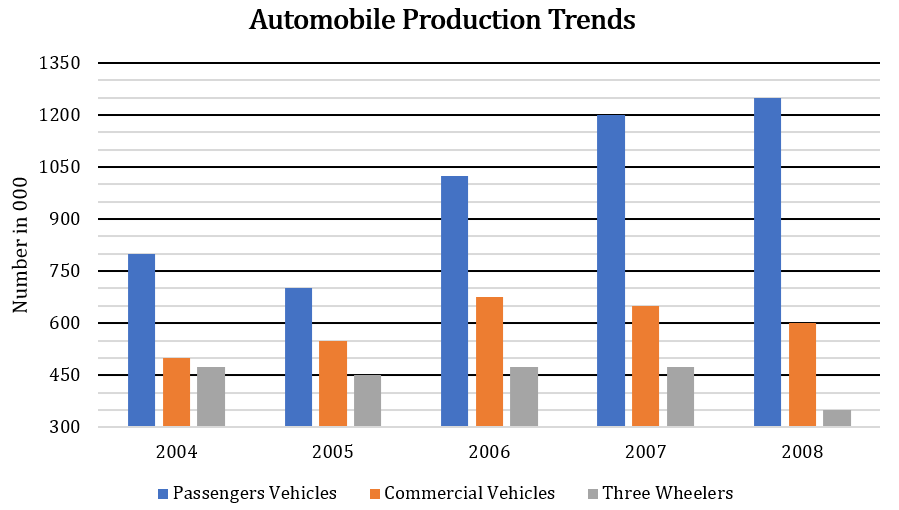
Which of the following year exhibited highest percentage decrease over the preceding year in the automobile production?
- A.
2005
- B.
2006
- C.
2007
- D.
2008
Answer: Option D
Explanation :
Total Automobile Production is as follows:
Year 2004: 800 + 500 + 475 = 1775
Year 2005: 700 + 550 + 450 = 1700
Year 2006: 1025 + 675 + 475 = 2175
Year 2007: 1200 + 650 + 475 = 2325
Year 2008: 1250 + 600 + 350 = 2200
2005 and 2008 show a decrease in automobile production.
Percentage decrease for 2005 = × 100 = 4.23%
Percentage decrease for 2008 = × 100 = 5.38%
Hence, option (d).
Workspace:
Assume whatever that is not sold domestically was exported, then which year has registered highest growth in exports of automobiles?
- A.
2005
- B.
2006
- C.
2007
- D.
2008
Answer: Option B
Explanation :
From the previous solution, we have total Automobile Production for the given years as follows:
2004: 1775;
2005: 1700;
2006: 2175
2007: 2325
2008: 2200
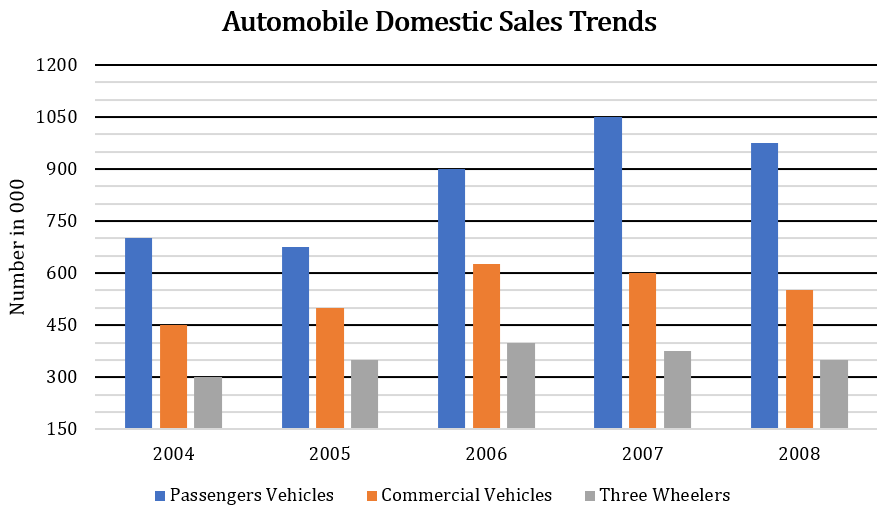
Now, domestic sales can be calculated as:
Year 2004: 700 + 450 + 300 = 1450
Year 2005: 675 + 500 + 350 = 1525
Year 2006: 900 + 625 + 400 = 1925
Year 2007: 1050 + 600 + 375 = 2025
Year 2008: 975 + 550 + 350 = 1875
Exports = Total Production – Domestic sales
∴ Exports for the given years:
2004 = 1775 – 1450 = 325
2005 = 1700 – 1525 = 175
2006 = 2175 – 1925 = 250
2007 = 2325 – 2025 = 300
2008 = 2200 – 1875 = 325
∴ Highest growth in exports was registered in the year 2006 = (250 – 175) = 75
Hence, option (b).
Workspace:
If the ratio of the domestic sale price of a commercial vehicle, a passenger vehicle, and a three wheeler is 5:3:2 then what percent of earnings (approximately) is contributed by commercial vehicle segment to the overall earnings from domestic sales during the period 2004-2008?
- A.
45%
- B.
43%
- C.
11%
- D.
27%
Answer: Option A
Explanation :
Total domestic sale for the year 2004-2008:
Commercial vehicles: 450 + 500 + 625 + 600 + 550 = 2725
Passenger vehicles: 700 + 675 + 900 + 1050 + 975 = 4300
Three wheelers: 300 + 350 + 400 + 375 + 350 = 1775
∴ Ratio of the total sale price of commercial vehicles, passenger vehicles and three wheelers = (5 × 2725) : (3 × 4300) : (2 × 1775)
∴ Contribution of commercial vehicles to the overall earnings
= × 100 ≈ 45%
Hence, option (a).
Workspace:
For which year were the domestic sales of automobiles closest to the average (2004-2008) domestic sales of automobiles?
- A.
2005
- B.
2006
- C.
2007
- D.
2008
Answer: Option D
Explanation :
Average domestic sales of automobiles:
(1450 + 1525 + 1925 + 2025 + 1875) ÷ 5 = 1760
The domestic sales in the year 2008 were closest to the average domestic sales.
Hence, option (d).
Workspace:
Which of the following years exhibited highest percentage increase over the preceding year in the automobile sales?
- A.
2005
- B.
2006
- C.
2007
- D.
2008
Answer: Option B
Explanation :
From the solution of question 2, we have the sales as follows:
Year 2004 = 1450
Year 2005 = 1525
Year 2006 = 1925
Year 2007 = 2025
Year 2008 = 1875
Subtracting the sales from the previous years, we get increase in the sales for:
Year 2005 = 75;
Year 2006 = 400;
Year 2007 = 100;
Year 2008 shows a decrease.
2006 shows the highest increase, i.e. its percentage increase in the highest.
Hence, option (b).
Workspace:
The ratio between absolute increase in domestic sales over preceding year and absolute increase in production over the preceding year is highest during which year?
- A.
2005
- B.
2006
- C.
2007
- D.
2008
Answer: Option B
Explanation :
From the previous solutions;
Increase in domestic sales over the preceding year:
Year 2005 = 75;
Year 2006 = 400;
Year 2007 = 100
Increase in production over the preceding year:
Year 2006 = 475;
Year 2007 = 150
Ratio for the year 2006 = 400 : 475 = 16 : 19
Ratio for the year 2007 = 100 : 150 = 2 : 3
Hence, option (b).
Workspace:
Answer the following question based on the information given below.
The table below gives the details of money allocation by three Mutual funds namely, Alpha, Beta, and Gama. The return for each fund depends on the money they allocate to different sectors and the returns generated by the sectors. The last column of the table gives return for each of the sectors for a one year period.
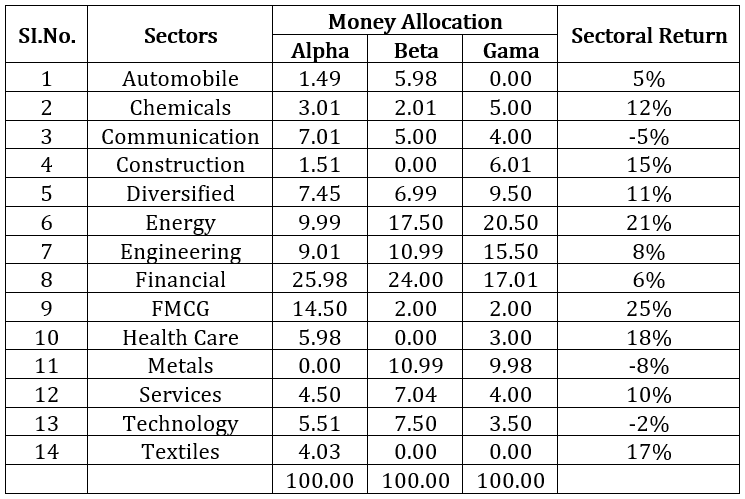
Which fund has received more return per rupee of investment for one year period?
- A.
Alpha
- B.
Beta
- C.
Gama
- D.
Both Beta and Gama gives same return
Answer: Option A
Explanation :
Returns for Alpha
= (1.49 × 1.05) + (3.01 × 1.12) + (7.01 × 0.95) + (1.51 × 1.15) + (7.48 × 1.11) + (9.99 × 1.21) + (9.01 × 1.08) + (25.98 × 1.06) + (14.5 × 1.25) + (5.98 × 1.18) + (4.5 × 1.1) + (5.51 × 0.98) + (4.03 × 1.17)
= 111.2383
Similarly, returns for Beta = 107.2281
and for Gama = 109.4837
Hence, option (a).
Workspace:
If the allocation of money by the fund managers to different sectors is based on the internal ranking (i.e. Sector with 1st rank gets highest allocation). Sectors with 0 allocation of money should be considered as 14th rank irrespective of the number of sectors in that category. In the light of these examine the following statements:
I. Automobile is ranked by both Alpha and Beta as same
II. Financial is most favoured by all three Mutual Funds
III. Services is ranked by all three Mutual Funds within top 9 ranks
Select the best option:
- A.
Statement I and II are correct
- B.
Statement I and III are correct
- C.
Statement I alone is correct
- D.
Statement III alone is correct
Answer: Option D
Explanation :
Preparing a table to show the ranks:
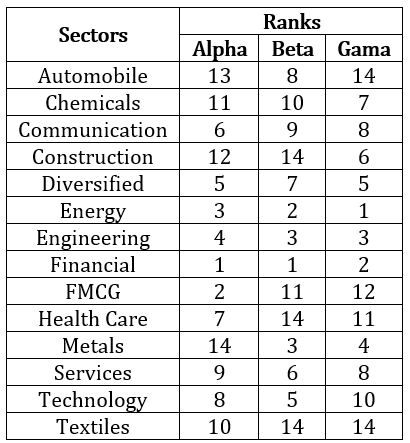
From the table, we can conclude that only statement III is correct.
Hence, option (d).
Workspace:
Ms. Hema invested Rs. 10.00 lakhs in fund Gama in the beginning of the period. What will be the value of the investment at the end of 1 year period?
- A.
Approximately Rs. 10.40 lakhs
- B.
Approximately Rs. 10.95 lakhs
- C.
Approximately Rs. 11.24 lakhs
- D.
Approximately Rs. 11.38 lakhs
Answer: Option B
Explanation :
Returns for Rs. 100 lakhs = Rs. 109.4837
∴ Returns for Rs. 10 lakhs ≈ Rs. 10.95 lakhs.
Hence, option (b).
Workspace:
Answer the following question based on the information given below.
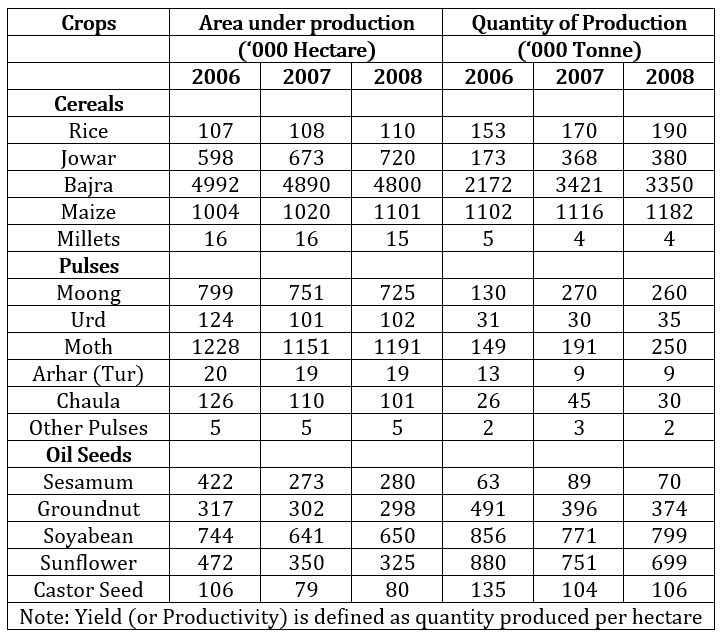
What is the ratio between Jowar yield (2007) and Soyabean yield (2008)?
- A.
1.00 : 2.10
- B.
1.21 : 1.89
- C.
0.89 : 2.00
- D.
0.78 : 1. 61
Answer: Option C
Explanation :
Jowar yield (2007) = 368/673
Soyabean yield (2008) = 799/650
Ratio = : ≈ 0.445
From the given options,
1.00 : 2.10 ≈ 0.476
1.21 : 1.89 ≈ 0.64
0.89 : 2.00 = 0.445
0.78 : 1.61 ≈ 0.484
Hence, option (c).
Workspace:
Top 3 crops by yield in the year 2006 are:
- A.
Castor Seed, Groundnut, Maize
- B.
Sunflower, Groundnut, Rice
- C.
Castor Seed, Sunflower, Rice
- D.
Bajra, Maize, Castor Seed
Answer: Option B
Explanation :
Let us calculate the yield for the crops given in the options for the year 2006:
Castor Seed = 135/106 ≈ 1.27
Groundnut = 491/317 ≈ 1.55
Maize = 1102/1004 ≈ 1.1
Sunflower = 880/472 ≈ 1.86
Rice = 153/107 ≈ 1.43
Bajra = 2172/4992 ≈ 0.43
The top three crops by yield are Sunflower, Groundnut and Rice.
Hence, option (b).
Workspace:
Bottom 3 crops by yield in the year 2008 are:Moth, Sesamum, Millets
- A.
Moth, Sesamum, Millets
- B.
Moong, Moth, Millets
- C.
Arhar, Urd, Moong
- D.
Moong, Sesamum, Chaula
Answer: Option A
Explanation :
Let us calculate the yield for the crops given in the options for the year 2008:
Moth = 250/1199 ≈ 0.21
Sesamum = 70/280 ≈ 0.25
Millets = 4/15 ≈ 0.27
Moong = 260/725 ≈ 0.36
Arhar = 9/19 ≈ 0.47
Urd = 35/102 ≈ 0.34
Chaula = 30/101 ≈ 0.30
The bottom three crops by yield are Moth, Sesamum and Millets.
Hence, option (a).
Workspace:
Examine the following statements:
I. Total productivity of pulses has gone down over the years
II. Maize is the most stable cereal in terms of productivity over the years
III. Percentage growth in area and quantity of production is highest in the case of Jowar during the entrie period.
Select the best option:
- A.
Statement I and II are correct
- B.
Statement I and III are correct
- C.
Statement II and III are correct
- D.
Statement III alone is correct
Answer: Option C
Explanation :
Total productivity has increased for some pulses and decreased for some.
∴ Statement I is incorrect.
Statements II and III are correct.
Hence, option (c).
Workspace:
Examine the following statements:I. Over the period total cereal productivity has gone up.
II. Area, Production and yield of the total oil seeds is on decline.
III. Though there is a decline in the area under Urd production but the quantity of production and yield has gone up over the years.
Select the best option:
- A.
Statement I and III are correct
- B.
Statement I and II are correct
- C.
Statement I alone is correct
- D.
Statement III alone is correct
Answer: Option A
Explanation :
On observing the table we see that,
The area under production of Cereals is approximately the same for the years 2006, 2007 and 2008 but the total quantity of production has increased.
∴ Over the period total cereal productivity has gone up.
∴ Statement I is correct.
Similarly on observing the table we can say that statement III is also correct.
Only statements I and III are correct.
Hence, option (a).
Workspace:
Answer the following question based on the information given below.
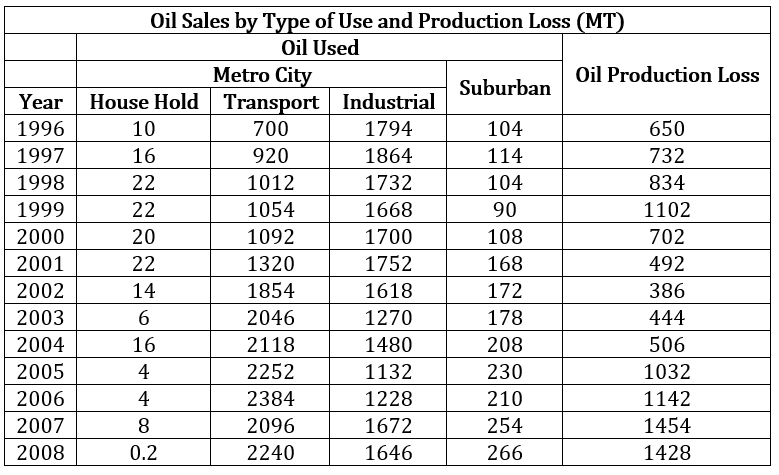
Note: Whatever is produced in a year is either used or lost in the production in the same year.
During which year the Oil used for House Hold as a percentage of Total Oil Used is highest?
- A.
1998
- B.
1999
- C.
2000
- D.
2001
Answer: Option B
Explanation :
Total Oil Used = House Hold + Transport + Industrial + Suburban
Total Oil Produced = Total Oil Used + Oil Production Loss
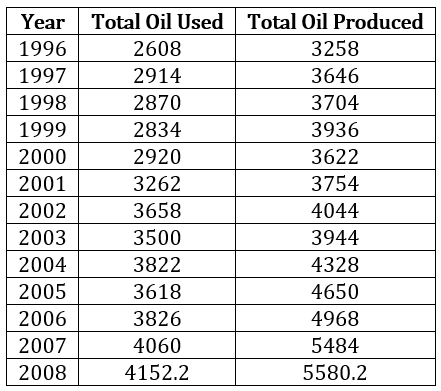
Now, Oil used for House Hold as a percentage of Total Oil Used:
During 1998 = × 100 ≈ 0.77%
During 1999 = × 100 ≈ 0.78%
During 2000 = × 100 ≈ 0.68%
During 2001 = × 100 ≈ 0.67%
It is highest during the year 1999.
Hence, option (b).
Workspace:
During which year the ‘Oil Production Loss’ as a proportion of ‘Total Oil Produced’ is the lowest?
- A.
2002
- B.
2003
- C.
2004
- D.
2006
Answer: Option A
Explanation :
Using the table given in the previous solution, we can find the ‘Oil Production loss’ as a proportion of ‘Total Oil Produced’
During 2002 = 386/4044 ≈ 0.095
During 2003 = 444/3944 ≈ 0.113
During 2004 = 506/4328 ≈ 0.117
During 2006 = 1142/4968 ≈ 0.230
Hence, option (a).
Workspace:
During which year use of oil by ‘Suburban’ as a proportion of ‘Total Oil Used’ was the highest?
- A.
2005
- B.
2006
- C.
2007
- D.
2008
Answer: Option D
Explanation :
Again using the table given in the solution of the first question of the set,
During 2005 = 230/3618 ≈ 0.0636
During 2006 = 210/3826 ≈ 0.055
During 2007 = 254/4030 ≈ 0.063
During 2008 = 266/4152.2 ≈ 0.064
Hence, option (d).
Workspace:
For how many number of years the growth rate in ‘Production of Oil’ is more than the growth rate in ‘Total Oil Used’?
- A.
3 years
- B.
4 years
- C.
5 years
- D.
8 years
Answer: Option D
Explanation :
Refer to the table given in solution 15.
Growth rate for ‘Production of Oil’:
Year 1997: (388/3258) × 100 = 11.91%
Year 1998: (58/3646) × 100 = 1.59%
Year 1999: (232/3704) × 100 = 6.26%
Year 2000: −(314/3936) × 100 = −7.98%
Year 2001: (132/3622) × 100 = 3.64%
Year 2002: (290/3754) × 100 = 7.73%
Year 2003: −(100/4044) × 100 = −2.47%
Year 2004: (384/3944) × 100 = 9.74%
Year 2005: (322/4328) × 100 = 7.44%
Year 2006: (318/4650) × 100 = 6.84%
Year 2007: (516/4968) × 100 = 10.39%
Year 2008: (96.2/5484) × 100 = 1.75%
Growth rate for ‘Total Oil Used’:
Year 1997: (306/2608) × 100 = 11.73%
Year 1998: −(44/2914) × 100 = −1.51%
Year 1999: −(36/2870) × 100 = −1.25%
Year 2000: (86/2834) × 100 = 3.03%
Year 2001: (342/2920) × 100 = 11.71%
Year 2002: (396/3262) × 100 = 12.14%
Year 2003: −(158/3658) × 100 = −4.32%
Year 2004: (322/3500) × 100 = 9.2%
Year 2005: −(204/3822) × 100 = −5.34
Year 2006: (208/3618) × 100 = 5.75%
Year 2007: (204/3826) × 100 = 5.33%
Year 2008: (122.2/4030) × 100 = 3.03%
The growth rate in ‘Production of Oil’ is more than that in ‘Total Oil Used’ during the years 1997, 1998, 1999, 2003, 2004, 2005, 2006 and 2007.
Hence, option (d).
Note:
The growth rate in 'Production of Oil' is more than that in 'Total Oil Used' for 8 years which was not there in the options in the paper. The 4th option in the paper was 6 years which has been changed here to 8 years.
Workspace:
Which of the below statements are true, based on the data in the above table?
- A.
Oil is used for ‘Transport’ purpose by Metro City is increasing every since 1996.
- B.
Oil is used for ‘Industrial’ purpose by Metro City is increasing every since 1996.
- C.
Oil used by ‘Suburban’ is increasing every year since 2000.
- D.
‘Total Oil Produced’ is increasing every year since 2003.
Answer: Option D
Explanation :
Total Oil Used = House Hold + Transport + Industrial + Suburban
Total Oil Produced = Total Oil Used + Oil Production Loss

Now, Oil used for House Hold as a percentage of Total Oil Used:
During 1998 = × 100 ≈ 0.77%
During 1999 = × 100 ≈ 0.78%
During 2000 = × 100 ≈ 0.68%
During 2001 = × 100 ≈ 0.67%
On observing the data given in the question and the table of the set, we can conclude that the correct statement is 4.
Hence, option (d).
Workspace:
Study the following information carefully and answer the questions.
Four houses Blue, Green, Red and Yellow are located in a row in the given order. Each of the houses is occupied by a person earning a fixed amount of a salary. The four persons are Paul, Krishna, Laxman, and Som.
Read the following instruction carefully:I. Paul lives between Som and Krishna
II. Laxman does not stay in Blue house
III. The person living in Red house earns more than that of person living in Blue
IV. Salary of Som is more than that of Paul but lesser than that of Krishna
V. One of the person earns Rs. 80, 000
VI. The person earning Rs. 110,000 is not Laxman
VII. The salary difference between Laxman and Son is Rs. 30,000
VIII. The House in which Krishna lives is located between houses with persons earning salaries of Rs. 30,000 and Rs. 50,000
IX. Krishna does not live in Yellow house, and the person living in yellow house is not earning lowest salary among the four persons.
Who lives in Red house?
- A.
Paul
- B.
Krishna
- C.
Laxman
- D.
Som
Answer: Option B
Explanation :
It is given that the four houses Blue, Green, Red and Yellow are located in a row, From (VIII) we get that the house in which Krishna lives is located between houses with persons earning salaries of Rs. 30,000 and Rs. 50,000.
∴ Two cases are possible:
Case 1: Krishna lives in the Green house.

Case 2: Krishna lives in the Red house.

Consider case 1: Krishna lives in the Green house.
From (I) we get that Paul lives between Som and Krishna.
∴ Som lives in the Yellow house and Paul lives in the Red house.
∴ Laxman lives in the Blue house.
From (VIII) we get that Krishna lives in the house which is located between houses with persons earning salaries of Rs. 30,000 and Rs. 50,000.
And from (III) we get that the person living in the Red house earns more than the person living in the Blue house.
∴ Paul earns Rs. 50,000 and Laxman earns Rs. 30,000.
From (VII) we get that the salary difference between Laxman and Som is Rs. 30,000 which is not possible in this case as the four given salaries are Rs. 30,000, Rs. 50,000, Rs. 80,000 and Rs. 1,10,000.
∴ Case 1 is not possible.
Consider case 2: Krishna lives in the Red house.
From (I) we get that Paul lives between Som and Krishna.
∴ Som lives in the Blue house and Paul lives in the Green house.
∴ Laxman lives in the Yellow house.
In condition (VIII) it is given that Krishna lives in the house located between houses with persons earning Rs. 30,000 and Rs. 50,000.
And from (IX) we get that the person living in the Yellow house is not earning lowest salary among the four persons.
∴ Laxman earns Rs. 50,000 and Paul earns Rs. 30,000.
From (III) we get that the person living in the Red house earns more than the person living in the Blue house.
∴ Krishna earns Rs. 1,10,000 and Som earns Rs. 80,000.

This case satisfies all the given conditions.
∴ Krishna lives in the Red house.
Hence, option (b).
Workspace:
Which house is occupied by person earning highest salary?
- A.
Blue
- B.
Green
- C.
Red
- D.
Yellow
Answer: Option C
Explanation :
It is given that the four houses Blue, Green, Red and Yellow are located in a row, From (VIII) we get that the house in which Krishna lives is located between houses with persons earning salaries of Rs. 30,000 and Rs. 50,000.
∴ Two cases are possible:
Case 1: Krishna lives in the Green house.

Case 2: Krishna lives in the Red house.

Consider case 1: Krishna lives in the Green house.
From (I) we get that Paul lives between Som and Krishna.
∴ Som lives in the Yellow house and Paul lives in the Red house.
∴ Laxman lives in the Blue house.
From (VIII) we get that Krishna lives in the house which is located between houses with persons earning salaries of Rs. 30,000 and Rs. 50,000.
And from (III) we get that the person living in the Red house earns more than the person living in the Blue house.
∴ Paul earns Rs. 50,000 and Laxman earns Rs. 30,000.
From (VII) we get that the salary difference between Laxman and Som is Rs. 30,000 which is not possible in this case as the four given salaries are Rs. 30,000, Rs. 50,000, Rs. 80,000 and Rs. 1,10,000.
∴ Case 1 is not possible.
Consider case 2: Krishna lives in the Red house.
From (I) we get that Paul lives between Som and Krishna.
∴ Som lives in the Blue house and Paul lives in the Green house.
∴ Laxman lives in the Yellow house.
In condition (VIII) it is given that Krishna lives in the house located between houses with persons earning Rs. 30,000 and Rs. 50,000.
And from (IX) we get that the person living in the Yellow house is not earning lowest salary among the four persons.
∴ Laxman earns Rs. 50,000 and Paul earns Rs. 30,000.
From (III) we get that the person living in the Red house earns more than the person living in the Blue house.
∴ Krishna earns Rs. 1,10,000 and Som earns Rs. 80,000.

From the final table in the solution of the set we get that,
The person earning highest salary i.e Rs. 1,10,000 is Krishna and he lives in the Red house.
Hence, option (c).
Workspace:
What is the salary earned by person living in Green house?
- A.
Rs. 30,000
- B.
Rs. 50,000
- C.
Rs. 80,000
- D.
Rs.110,000
Answer: Option A
Explanation :
The person living in the Green house is Paul and the salary earned by him is Rs. 30,000.
Hence, option (a).
Workspace:
Mr Raghav went in his car to meet his friend John. He Drove 30 kms towards north and then 40 kms towards west. He then turned to south and covered 8 kms. Further he turned to east and moved 26 kms. Finally he turned right and drove 10 kms and then turned left to travel 19 kms. How far and in which direction is he from the starting point?
- A.
East of starting point, 5 kms
- B.
East of starting point, 13 kms
- C.
North East of starting point, 13 kms
- D.
North East of starting point, 5 kms
Answer: Option C
Explanation :
From the directions given in the questions following diagram can be drawn:
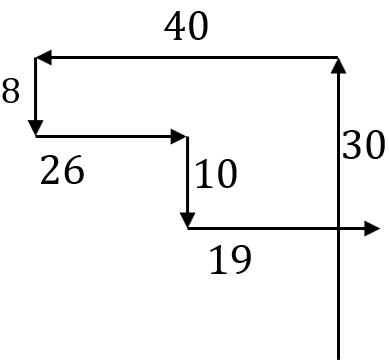
The distance between the Starting point and the final position of Mr. Raghav can be determined using Pythagoras theorem with the two sides as 12 and 5.
∴ Mr. Raghav is 13 kms to the North east of the starting point.
Hence, option (c).
Workspace:
Mr. Raju took the members of his family for a picnic. His father’s mother and mother’s father including their two children were in one car. His father’s son and sister’s husband, brother’s wife were in second car. He along with his wife, wife’s sister, wife’s brother and son’s wife with a kid was in the third car. How many members of Mr. Raju’s family were there in the picnic along with Mr. Raju and how many were left behind (assuming all members of the third generation are married)?
- A.
13 and 4
- B.
14 and 5
- C.
12 and 5
- D.
13 and 6
Answer: Option A
Explanation :
It is given that Mr. Raju’s father’s mother, mother’s father and their children were in one car.
∴ His paternal grandmother, maternal grandfather, Mother and Father were in the first car.
Mr. Raju’s father’s son, sister’s husband and brother’s wife were in the second car.
Raju’s father’s son has to be his brother as Raju himself was in the third car.
∴ Raju’s brother, Brother-in-law (sister’s husband) and sister-in-law (brother’s wife) were in the second car.
Mr. Raju, his wife, wife’s sister, wife’s brother, son’s wife with a kid were in the third car.
∴ Mr. Raju, his wife, sister-in-law (wife’s sister), brother-in-law (wife’s brother), son’s wife and grandson were in the third car.
∴ Car 1: Paternal Grandmother, Maternal Grandfather, Mother and Father.
Car 2: Brother, Sister-in-law (brother’s wife) and Brother-in-law (sister’s husband).
Car 3: Raju, his wife, Sister-in-law (wife’s sister), Brother-in-law (wife’s brother), Son’s wife and Grandson.
∴ 13 members of Raju’s family were there in the picnic and 4 members i.e. Raju’s Sister, his wife’s brother-in-law, his wife’s sister-in-law and his son were left behind.
Hence, option (a).
Workspace:
ABCDE play a game of cards. ‘A’ tells ‘B’ that if ‘B’ gives him five cards ‘A’ will have as many cards as ‘E’ has. However if A gives five cards to ‘B’ then ‘B’ will have as many cards as ‘D’. A and B together has 20 cards more than what D and E have together. B has four cards more than what C has and total number of cards are 201. How many cards B have?
- A.
185
- B.
37
- C.
175
- D.
27
Answer: Option A
Explanation :
Data given in the question is not correct.
Let a, b, c, d and e be the number of cards with A, B, C, D and E.
If B gives A five cards, A will have as many cards as E.
∴ e = a + 5 …(i)
If A gives B five cards, B will have as many cards as D.
∴ d = b + 5 …(ii)
A and B together have 20 cards more than what D and E have together.
∴ a + b = e + d + 20 …(iii)
It is also given that B has four cards more than what C has and the total number of cards are 201.
∴ b = c + 4 and …(iv)
a + b + c + d + e = 201 …(v)
Adding (i) and (ii) we get e + d = a + b + 10 which contradicts equation (iii)
∴ The data given in the question is not correct.
Workspace:
Ganesh Cultural Centre for promoting arts has appointed 3 instructors for music, dance, and painting. Music instructor takes session from 12 noon to 4:00 pm on Monday, Thursday and Sunday. The sessions of dance instructor are scheduled on Tuesday, Thursday, Wednesday and Sunday between 10:00 am to 2:00 pm. The 9:00 am to 12:00 noon slot on Tuesday, Friday and Thursday and also 2:00 pm to 4:00 pm slot on Wednesday, Saturday and Sunday is filled up by Painting Instructor. On which day(s) of a week the dance and painting sessions are simultaneously held?
- A.
Sunday and Wednesday
- B.
Tuesday and Friday
- C.
Tuesday and Thursday
- D.
Only on Tuesday
Answer: Option C
Explanation :
Music instructor takes session from 12 noon to 4:00 pm on Monday, Thursday and Sunday.
Sessions of dance instructor are scheduled between 10:00 am to 2:00 pm. on Tuesday, Thursday, Wednesday and Sunday.
Painting instructor takes sessions between 9:00 am to 12:00 noon on Tuesday, Friday and Thursday and between 2:00 pm to 4:00 pm on Wednesday, Saturday and Sunday.
∴ The dance and painting sessions are simultaneously held on days common to the sessions held by dance instructor between 10:00 am to 2:00 pm and the sessions held by the painting instructor between 9:00 am and 12:00 noon i.e. Tuesday and Thursday.
Hence, option (c).
Workspace:
Study the following information carefully and answer the questions.
The following table contains the pre and post revision pay structure of a Government department:

The revision has been done based on the following terms:
- In pre-revised pay scale, the basic pay is the sum of the minimum pay in the appropriate pay scale and the admissible increment. After revision, the basic pay is the sum of minimum pay in the appropriate pay scale and the respective grade pay and the admissible increments.
- Annual increment of 3% of the basic pay (on a compounded basic) is paid under the revised pay rules.
- Monthly Dearness Allowance (DA) is calculated as percentage of basic pay.
- In pre-revised pay scales, the increment was given after the completion of each year of service, but, after revision annual increments are given only in the month of July every year and there should be a gap of six months between the increments. The employees who had joined the department in the month of September, October, November and December are given an increment at the time of revised pay fixation in September, 2008.
- The revised pay is applicable from 1st September, 2008.
Abhijit joins the department on November 10, 2006 in the pay scale of Rs. 18400-500-22400 with the pay of Rs.18400 plus 2 increments. What is his basic salary, after revision, on August 1, 2009?
- A.
Rs.53010
- B.
Rs.53349
- C.
Rs.54950
- D.
Rs.54903
Answer: Option C
Explanation :
As Abhijit already had two increments and during the given period he will get three increments.
Hence his salary on August 1, 2009
= (37400 + 10000)(1.03)5
= Rs. 54949.5
≈ Rs. 54950
Hence, option (c).
Workspace:
Nitin joined the department on November 24, 2004 in the pay scale of Rs.8000-275-13500, at the minimum pay. At the time of pay revision, due to some error, his pay was fixed at the base (minimum) of the corresponding revised pay scale. The loss in his total emoluments for September 2008, due to this error, will be:
- A.
Rs.3915
- B.
Rs.3982
- C.
Rs.4164
- D.
No loss
Answer: Option C
Explanation :
Loss in total emoluments of Nitin
= 23635 × 1.58 – 21000 × 1.58
= Rs. 4163.3 ≈ Rs. 4164
Hence, option (c).
Workspace:
Sunitha joined the department at the basic pay of Rs. 13500 in the pay scale of Rs. 12000-16500. On completion of her four years of service in December, 2008, she was promoted to the next higher pay scale, the percentage increase in her gross salary is:
- A.
53%
- B.
43%
- C.
50%
- D.
60%
- E.
None of these
Answer: Option A
Explanation :
Sunitha’s salary before the promotion
= (15600 + 7600)(1.03)(1.58) + 3200
≈ Rs. 49635
After the promotion it will be = (46300)(1.58) + 3200 = Rs. 76354
∴ The required percentage growth = × 100 = 53.8%
By considering Rs. 3,200 additionally as mentioned in table, under Transport Allowance (TA) it will be
× 100 = 50.5%
Hence, option (a) or 3.
Workspace:
Dinesh joined on July 1, 2008 in the pay scale of Rs.16400-20,000 at the basic pay of Rs.16850. On August 10, 2009, the department revised the rates of DA to 31% with effect from January, 2009 and further to 36% effective from July 2009. How much arrear will Dinesh get in August, 2009 because of these revisions?
- A.
Rs.12981
- B.
Rs.10395
- C.
Rs.17052
- D.
Rs.13302
Answer: Option A
Explanation :
Arrears that Dinesh will get
= (3 × 6)% of 47689 + 8% of 49120
= 8584 + 3930
= Rs. 12514
which is not in the options.
Workspace:
Study the following information carefully and answer the questions.
A word arrangement machine, when given a particular input, rearranges it using a particular rule. The following is the illustration and the steps of the arrangement
INPUT: Smile Nile Style Mile Shine Wine Mine Swine Bovine Feline
STEP 1: Smile Nile Style Mile Shine Wine Bovine Feline Mine Swine
STEP 2: Style Mile Smile Nile Shine Wine Bovine Feline Mine Swine
STEP 3: Style Mile Smile Nile Wine Shine Bovine Feline Mine Swine
STEP 4: Mile Style Nile Smile Wine Shine Feline Bovine Swine Mine
STEP 5: Nile Smile Mile Style Wine Shine Swine Mine Feline Bovine
STEP 6: Nile Smile Mile Style Wine Shine Feline Bovine Swine Mine
STEP 7: Mile Style Nile Smile Wine Shine Feline Bovine Swine Mine
If the arrangement is repeated which of the steps given below is same as the INPUT row?
- A.
Step 9
- B.
Step 11
- C.
Step 20
- D.
Step 14
Answer: Option C
Explanation :
If we divide the given input into 5 groups with 2 words each then the groups can be written as:
Group 1: Smile Nile
Group 2: Style Mile
Group 3: Shine Wine
Group 4: Mine Swine
Group 5: Bovine Feline
Group numbers are given in the order in which they are given in that STEP.
Then the steps of rearrangement can be written as:
STEP 1: Position of group 4 is interchanged with position of group 5.
STEP 2: Position of group 1 in step 1 is interchanged with position of group 2.
STEP 3: Position of the words of group 3 in step 2 is interchanged.
STEP 4: Position of words of group 1, group 2, group 3 and group 5 are interchanged.
For example: If the words in group 1 in step 3 are Smile Nile then the words in group 1 of step 4 will be Nile Smile.
STEP 5: Position of group 1 is interchanged with position of group 2 and position of group 4 is interchanged with position of group 5.
STEP 6: Position of group 4 is interchanged with the position of group 5.
STEP 7: Position of group 1 is interchanged with the position of group 2.
∴ We can say that the algorithm of rearrangement repeats after 5 steps.
∴ STEP 8 for the given input will be:
STEP 8: Mile Style Nile Smile Shine Wine Feline Bovine Swine Mine
STEP 9: Style Mile Smile Nile Shine Wine Bovine Feline Mine Swine
STEP 10: Smile Nile Style Mile Shine Wine Mine Swine Bovine Feline
STEP 11: Smile Nile Style Mile Shine Wine Bovine Feline Mine Swine
STEP 12: Style Mile Smile Nile Shine Wine Bovine Feline Mine Swine
STEP 13: Style Mile Smile Nile Wine Shine Bovine Feline Mine Swine
STEP 14: Mile Style Nile Smile Wine Shine Feline Bovine Swine Mine
STEP 15: Nile Smile Mile Style Wine Shine Swine Mine Feline Bovine
STEP 16: Nile Smile Mile Style Wine Shine Feline Bovine Swine Mine
STEP 17: Mile Style Nile Smile Wine Shine Feline Bovine Swine Mine
STEP 18: Mile Style Nile Smile Shine Wine Feline Bovine Swine Mine
STEP 19: Style Mile Smile Nile Shine Wine Bovine Feline Mine Swine
STEP 20: Smile Nile Style Mile Shine Wine Mine Swine Bovine Feline
Referring the Steps given in the solution we get that,
STEP 20 is same as the given input.
Hence, option (c).
Workspace:
Which of the following will be step 14 for the given input:
- A.
Style Mile Smile Nile Wine Shine Bovine Feline Mine Swine
- B.
Smile Nile Style Mile Shine Wine Mine Swine Bovine Feline
- C.
Mile Style Nile Smile Shine Wine Feline Bovine Swine Mine
- D.
Style Mile Smile Nile Shine Wine Bovine Feline Mine Swine
Answer: Option C
Explanation :
If we divide the given input into 5 groups with 2 words each then the groups can be written as:
Group 1: Smile Nile
Group 2: Style Mile
Group 3: Shine Wine
Group 4: Mine Swine
Group 5: Bovine Feline
Group numbers are given in the order in which they are given in that STEP.
Then the steps of rearrangement can be written as:
STEP 1: Position of group 4 is interchanged with position of group 5.
STEP 2: Position of group 1 in step 1 is interchanged with position of group 2.
STEP 3: Position of the words of group 3 in step 2 is interchanged.
STEP 4: Position of words of group 1, group 2, group 3 and group 5 are interchanged.
For example: If the words in group 1 in step 3 are Smile Nile then the words in group 1 of step 4 will be Nile Smile.
STEP 5: Position of group 1 is interchanged with position of group 2 and position of group 4 is interchanged with position of group 5.
STEP 6: Position of group 4 is interchanged with the position of group 5.
STEP 7: Position of group 1 is interchanged with the position of group 2.
∴ We can say that the algorithm of rearrangement repeats after 5 steps.
∴ STEP 8 for the given input will be:
STEP 8: Mile Style Nile Smile Shine Wine Feline Bovine Swine Mine
STEP 9: Style Mile Smile Nile Shine Wine Bovine Feline Mine Swine
STEP 10: Smile Nile Style Mile Shine Wine Mine Swine Bovine Feline
STEP 11: Smile Nile Style Mile Shine Wine Bovine Feline Mine Swine
STEP 12: Style Mile Smile Nile Shine Wine Bovine Feline Mine Swine
STEP 13: Style Mile Smile Nile Wine Shine Bovine Feline Mine Swine
STEP 14: Mile Style Nile Smile Wine Shine Feline Bovine Swine Mine
STEP 15: Nile Smile Mile Style Wine Shine Swine Mine Feline Bovine
STEP 16: Nile Smile Mile Style Wine Shine Feline Bovine Swine Mine
STEP 17: Mile Style Nile Smile Wine Shine Feline Bovine Swine Mine
STEP 18: Mile Style Nile Smile Shine Wine Feline Bovine Swine Mine
STEP 19: Style Mile Smile Nile Shine Wine Bovine Feline Mine Swine
STEP 20: Smile Nile Style Mile Shine Wine Mine Swine Bovine Feline
∴ STEP 14 for the given input is
Mile Style Nile Smile Wine Shine Feline Bovine Swine Mine
No option is matching with the STEP 14 but the closest option is option C which should have had Wine Shine instead of Shine Wine.
Hence, option (c).
Workspace:
Mark the arrangement that does not fall between step numbers 12 and 14.
- A.
Style Mile Smile Nile Wine Shine Bovine Feline Mine Swine
- B.
Mile Style Nile Smile Wine Shine Feline Bovine Swine Mine
- C.
Style Mile Smile Nile Shine Wine Bovine Feline Mine Swine
- D.
Smile Nile Style Mile Shine Wine Bovine Feline Mine Swine
Answer: Option D
Explanation :
If we divide the given input into 5 groups with 2 words each then the groups can be written as:
Group 1: Smile Nile
Group 2: Style Mile
Group 3: Shine Wine
Group 4: Mine Swine
Group 5: Bovine Feline
Group numbers are given in the order in which they are given in that STEP.
Then the steps of rearrangement can be written as:
STEP 1: Position of group 4 is interchanged with position of group 5.
STEP 2: Position of group 1 in step 1 is interchanged with position of group 2.
STEP 3: Position of the words of group 3 in step 2 is interchanged.
STEP 4: Position of words of group 1, group 2, group 3 and group 5 are interchanged.
For example: If the words in group 1 in step 3 are Smile Nile then the words in group 1 of step 4 will be Nile Smile.
STEP 5: Position of group 1 is interchanged with position of group 2 and position of group 4 is interchanged with position of group 5.
STEP 6: Position of group 4 is interchanged with the position of group 5.
STEP 7: Position of group 1 is interchanged with the position of group 2.
∴ We can say that the algorithm of rearrangement repeats after 5 steps.
∴ STEP 8 for the given input will be:
STEP 8: Mile Style Nile Smile Shine Wine Feline Bovine Swine Mine
STEP 9: Style Mile Smile Nile Shine Wine Bovine Feline Mine Swine
STEP 10: Smile Nile Style Mile Shine Wine Mine Swine Bovine Feline
STEP 11: Smile Nile Style Mile Shine Wine Bovine Feline Mine Swine
STEP 12: Style Mile Smile Nile Shine Wine Bovine Feline Mine Swine
STEP 13: Style Mile Smile Nile Wine Shine Bovine Feline Mine Swine
STEP 14: Mile Style Nile Smile Wine Shine Feline Bovine Swine Mine
STEP 15: Nile Smile Mile Style Wine Shine Swine Mine Feline Bovine
STEP 16: Nile Smile Mile Style Wine Shine Feline Bovine Swine Mine
STEP 17: Mile Style Nile Smile Wine Shine Feline Bovine Swine Mine
STEP 18: Mile Style Nile Smile Shine Wine Feline Bovine Swine Mine
STEP 19: Style Mile Smile Nile Shine Wine Bovine Feline Mine Swine
STEP 20: Smile Nile Style Mile Shine Wine Mine Swine Bovine Feline
Referring the Steps given in the solution we get that,
Option A is step 13.
Option B is step 14.
Option C is step 12.
Option D does not fall between step numbers 12 and 14.
Hence, option (d).
Workspace:
Answer the following question based on the information given below.
A Prime Minister is contemplating the expansion of his cabinet. There are four ministerial berths and there are eight probable candidates (C1-C8) to choose from. The selection should be in a manner that each selected person shares a liking with at least one of the other three selected members. Also, the selected must also hate at least one of the likings of any of the other three persons selected.
I. C1 likes travelling and sightseeing, but hates river rafting
II. C2 likes sightseeing and squash, but hates travelling
III. C3 likes river rafting, but hates sightseeing
IV. C4 likes trekking, but hates squash
V. C5 likes squash, but hates sightseeing and trekking
VI. C6 likes travelling, but hates sightseeing and trekking
VII. C7 likes river rafting and trekking, but hates travelling, and
VIII. C8 likes sightseeing and river rafting, but hates trekking
Who are the four people selected by the Prime Minister?
- A.
C1, C2, C5, C6
- B.
C3, C4, C5, C6
- C.
C1, C2, C4, C7
- D.
None of the above
Answer: Option C
Explanation :
If the liking of a person is denoted by √ and whatever a person hates is denoted by × then the data given can be represented in a tabular format as:

Now, each selected member should share a liking with at least one of the other three selected members and the selected member must also hate at least one of the likings of any of the other persons selected.
Consider option 1:
C1, C2, C5 and C6 cannot be the four people selected by the Prime Minister as C1 hates only River rafting which is not liked by any of the other three.
Consider option 2:
C3, C4, C5 and C6 cannot be the four people selected by the Prime Minister as none of them shares a liking with any other member, also C3 and C6 hate Sightseeing which is not liked by any of them.
Consider option 3:
C1, C2, C4 and C7 are the four people selected by the Prime Minister as all of them share at least one liking with at least one of the three selected members and all of them also hate at least one of the likings of at least one of the selected persons.
Hence, option (c).
Workspace:
Feedback
Help us build a Free and Comprehensive Preparation portal for various competitive exams by providing us your valuable feedback about Apti4All and how it can be improved.
 Solution
 Discuss
 Report