IIFT 2013 LRDI | Previous Year IIFT Paper
Answer the following question based on the information given below.
Given below are the shares of sectoral FDI inflow to India in different years (figures in percentage). Answer the questions on the basis of following data.
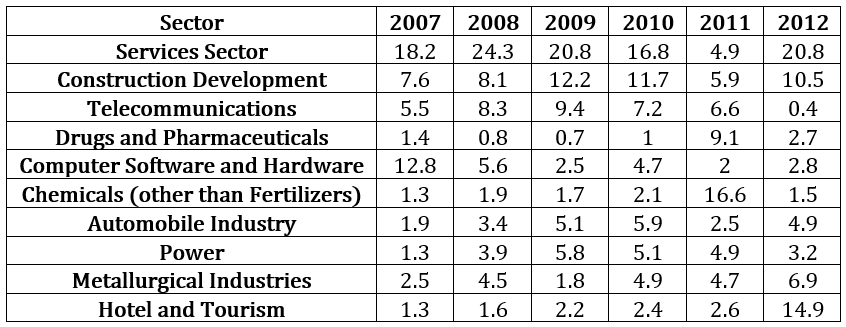
Among the four sectors mentioned below, the increase in share of FDI inflow between the terminal years 2007 and 2012 has been HIGHEST for
- A.
Services Sector
- B.
Construction Development
- C.
Automobile Industry
- D.
Power
Answer: Option C
Explanation :
The absolute increase in the given sectors is:
Services Sector: 2.6
Construction Development : 2.9
Automobile Industry : 3
Power : 1.9
Therefore, it is the highest for the Automobile Industry.
Hence, option (c).
Workspace:
Over 2007 to 2012, the simple average share of FDI inflows has been SECOND LOWEST for
- A.
Chemicals (other than Fertilizers)
- B.
Automobile Industry
- C.
Metallurgical Industries
- D.
Hotel and Tourism
Answer: Option B
Explanation :
Since the average share for each sector is to be calculated over the same period, the sector with the highest FDI inflow over the given period will also have the highest average. The actual average need not be found.
The share of total FDI inflows from the period 2007 to 2012 for the given sectors is:
Chemicals (other than Fertilizers): 25.1
Automobile Industry: 23.7
Metallurgical Industries: 25.3
Hotel and Tourism: 25.0
But, for Drugs and Pharmaceuticals, the share of total FDI inflows over the given period was 15.7. Thus, the share has been SECOND LOWEST for the Automobile Industry.
Hence, option (b).
Workspace:
Identify the FALSE Statement from the following sentences
- A.
During 2009 to 2012 the percentage share of FDI inflow in power sector has witnessed a continuous decline.
- B.
During 2007 to 2009 the percentage share of FDI inflow in drug and pharmaceuticals sector has witnessed a continuous decline.
- C.
During 2009 to 2011 the percentage share of FDI inflow in Hotel and Tourism sector has witnessed a continuous increase.
- D.
During 2007 to 2010 the percentage share of FDI inflow in Chemicals (other than Fertilizers) sector has witnessed a continuous increase.
Answer: Option D
Explanation :
It can be verified from the table that options 1, 2 and 3 are true.
Option 4 is false. The percentage share of FDI inflow from 2007 to 2010 in Chemicals (other than Fertilizers) does not show a continuous increase.
Hence, option (d).
Workspace:
Identify the TRUE alternative from the given options based on the following statements
i. In 2011, the construction development sector was ranked fifth in terms of percentage share of FDI inflow in the country
ii. In 2009, the Computer Software and Hardware sector was ranked sixth in terms of percentage share of FDI inflow in the country
iii. In 2012, the drugs and pharmaceuticals sector was ranked fourth lowest from the bottom in terms of percentage share of FDI inflow in the country
- A.
Statement ii only
- B.
Both statement i and ii
- C.
Statement iii only
- D.
All three statements
Answer: Option A
Explanation :
Statements (ii) is true.
In 2011, the construction development sector was ranked 4th in terms of percentage of FDI inflow in the country.
In 2012, the Drugs and Pharmaceuticals sector was ranked 3rd lowest from the bottom in terms of percentage of FDI inflow in the country.Hence, statement (i) and (iii) are false.
Hence, option (a).
Workspace:
Mark the HIGHEST figure among the following options
- A.
Increase in FDI inflow percentage share for Telecommunications sector between 2007 and 2008
- B.
Increase in FDI inflow percentage share for Computer Software and Hardware sector between 2009 and 2010
- C.
Increase in FDI inflow percentage share for Automobile sector between 2011 and 2012
- D.
Increase in FDI inflow percentage share for Power sector between 2007 and 2008
Answer: Option A
Explanation :
Increase in FDI inflow percentage share for different sectors is as follows :
Telecommunications between 2007 and 2008: 2.8
Computer Software and Hardware between 2009 and 2010: 2.2
Automobile between 2011 and 2012: 2.4
Power between 2007 and 2008: 2.6
The highest figure is 2.8.
Hence, option (a).
Workspace:
Answer the following question based on the information given below.
Given below are the shares of India’s export basket to different regions (figures in percentage). Answer the questions on the basis of following data.

Among the four options mentioned below, export share of India witnessed HIGHEST year-to-year decline in absolute terms in which of the region-period combinations?
- A.
In ASEAN region from 2005-06 to 2006-07
- B.
In South Asian region from 2004-05 to 2005-06
- C.
In West Asia (GCC) region from 2008-09 to 2009-10
- D.
In North African region from 2009-10 to 2010-11
Answer: Option D
Explanation :
Find the individual absolute decline for the given region – period combinations.
ASEAN (05-06 to 06-07) = 10.10 – 9.98 = 0.12
South Asian (04-05 to 05-06) = 5.51 – 5.38 = 0.13
West Asia (GCC)(08-09 to 09-10) = 17.21 – 17.06 = 0.15
North Africa (09-10 to 10-11) = 1.75 – 1.59 = 0.16
Hence, option (d).
Workspace:
Among the four options mentioned below, for which region have the export shares declined maximum number of times in a year-on-year basis?
- A.
South Asia
- B.
North East Asia
- C.
North America
- D.
EU Countries
Answer: Option C
Explanation :
It can be verified from the table that export shares have decreased 7 times for North America and 6 times each for the other three regions.
Hence, option (c).
Workspace:
Between 2009-10 and 2010-11, the annual growth rate in India’s (percentage) export shares has been LOWEST for
- A.
North Africa
- B.
North East Asia
- C.
North America
- D.
EU Countries
Answer: Option A
Explanation :
For all four given regions, growth is negative for the given period. Hence, the annual growth rate is lowest for the region with the greatest magnitude of growth rate.
The annual growth for the given regions is:
North Africa = × 100 = -9.14%
North East Asia = × 100 = -8%
North America = × 100 = -7.65%
EU Countries = × 100 = -9.07%
Hence, option (a).
Workspace:
Mark the HIGHEST figure from the following options
- A.
India’s simple average export share to North Africa during 2008-09 and 2009-10
- B.
India’s simple average export share to East Africa during 2004-05 and 2007-08
- C.
India’s simple average export share to Latin Africa during 2002-03 and 2004-05
- D.
India’s simple average export share to West Africa during 2007-08 and 20010-11
Answer: Option C
Explanation :
In all the options, the simple average export share is calculated over the same time period. So, there is no need to calculate the average. Just find the highest total share for each region given in the options.
North Africa (2008-09 & 2009-10) =1.84 + 1.75 = 3.59
East Africa (2004-05 & 2007-08) = 1.37 + 2.58 = 3.95
Latin America (2002-03 & 2004-05) = 2.06 + 2.15 = 4.21
West Africa (2007-08 & 2010-11) = 2.13 + 1.71 = 3.84
Hence, option (c).
Workspace:
Identify the FALSE statement
- A.
In 2011-12, South Asia was ranked sixth in India’s export basket
- B.
The export share of North Africa in India’s export basket has been the lowest for maximum numbers of years
- C.
In 2004-05, Latin America was ranked fourth from the bottom in India’s export basket
- D.
Between 2002-03 and 2003-04, the annual growth rate I India’s (percentage) export share has been highest for West Asia (GCC) market.
Answer: Option D
Explanation :
More calculations are required to verify option 4 compared to the other three. So, it is faster to check options 1, 2 and 3 before moving on to option 4 (if required).
Option 1 is true as South Asia is ranked 6th.
Option 2 is true as North Africa has the lowest export share for 7 years, while East Africa has the lowest export share for only 3 years.
Option 3 is true as Latin America (2.15) has the fourth lowest export share in 2004-05 with East Africa (1.37), North Africa (1.62) and West Africa (1.98) below it.
As options 1, 2 & 3 are true, option 4 has to be false.
Hence, option (d).
Workspace:
Answer the following question based on the information given below.
Given below are the detailed characteristics of select India industries. Answer the question on the basis of the following data.

If total ,managerial wage bill is defined as the difference between total emoluments and total wage to workers, and total managerial staff is defined as the difference between total person engaged and total number of workers, then average managerial wage would be HIGHEST for:
- A.
Industry 5
- B.
Industry 6
- C.
Industry 3
- D.
Industry 7
Answer: Option B
Explanation :

Thus, the average managerial wage is highest for industry 6
Hence, option (b).
Alternatively,
Once the total managerial wage bill and the total managerial staff have been calculated, observe that the managerial wage bill is more than thrice the managerial staff for industry 6. It is less than 3 for the remaining industries. Since the highest value is required, industry 6 can be directly marked as the answer.
Hence, option (b).
Workspace:
Profit expressed as a ratio of net value added is HIGHEST for
- A.
Industry 6
- B.
Industry 7
- C.
Industry 4
- D.
Industry 5
Answer: Option A
Explanation :

Thus, the profit expressed as a ratio of net value added is highest for Industry 6.
Hence, option (a).
Workspace:
If gross value added is defined as the sum of net value added and depreciation, then the difference in the gross value added per worker is maximum between which of the following paira?
- A.
Industry 6 and Industry 3
- B.
Industry 7 and Industry 1
- C.
Industry 5 and Industry 2
- D.
Industry 6 and Industry 4
Answer: Option C
Explanation :
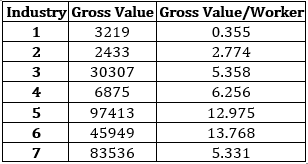
The difference required in each option is :
Option 1: 8.41
Option 2: 4.976
Option 3: 10.201
Option 4: 7.512
Thus, the difference is highest for option 3.
Hence, option (c).
Workspace:
Expense on fuel consumption as a percentage of input cost has been HIGHEST for
- A.
Industry 3
- B.
Industry 7
- C.
Industry 2
- D.
Industry 6
Answer: Option B
Explanation :

The fuel consumption as a percentage of input cost is highest for industry 7.
Hence, option (b).
Workspace:
Identify the TRUE statement
- A.
Number of worker’s per factory is third highest for industry 6
- B.
Expense on Material consumption expressed as a percentage of input cost is second highest for industry 4
- C.
Profit earned expressed as a percentage of emolument is second highest for Industry 7
- D.
Emoluments expressed as a percentage of net value added is lowest for Industry 5
Answer: Option D
Explanation :
In each option, a certain ratio has to be found and its rank for a specific industry is to be verified.
Option 1: Number of workers per factory
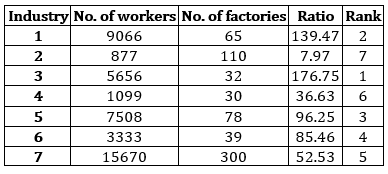
Thus, the statement in option 1 is false.
Option 2: Expense on material consumption as a % of input cost
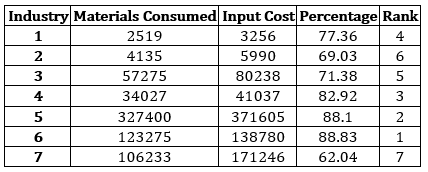
Thus, the statement in option 2 is false.
Option 3: Profit earned as a % of emolument
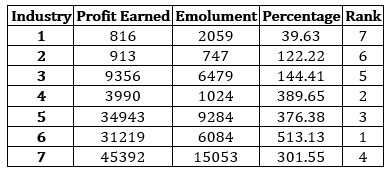
Thus, the statement in option 3 is false.
Hence, option (d).
Note:
Since the first three options are proved to be false, the last has to be true. There is no need to calculate it, but it can be verified using a similar table, as shown above.
Workspace:
Answer the following question based on the information given below.
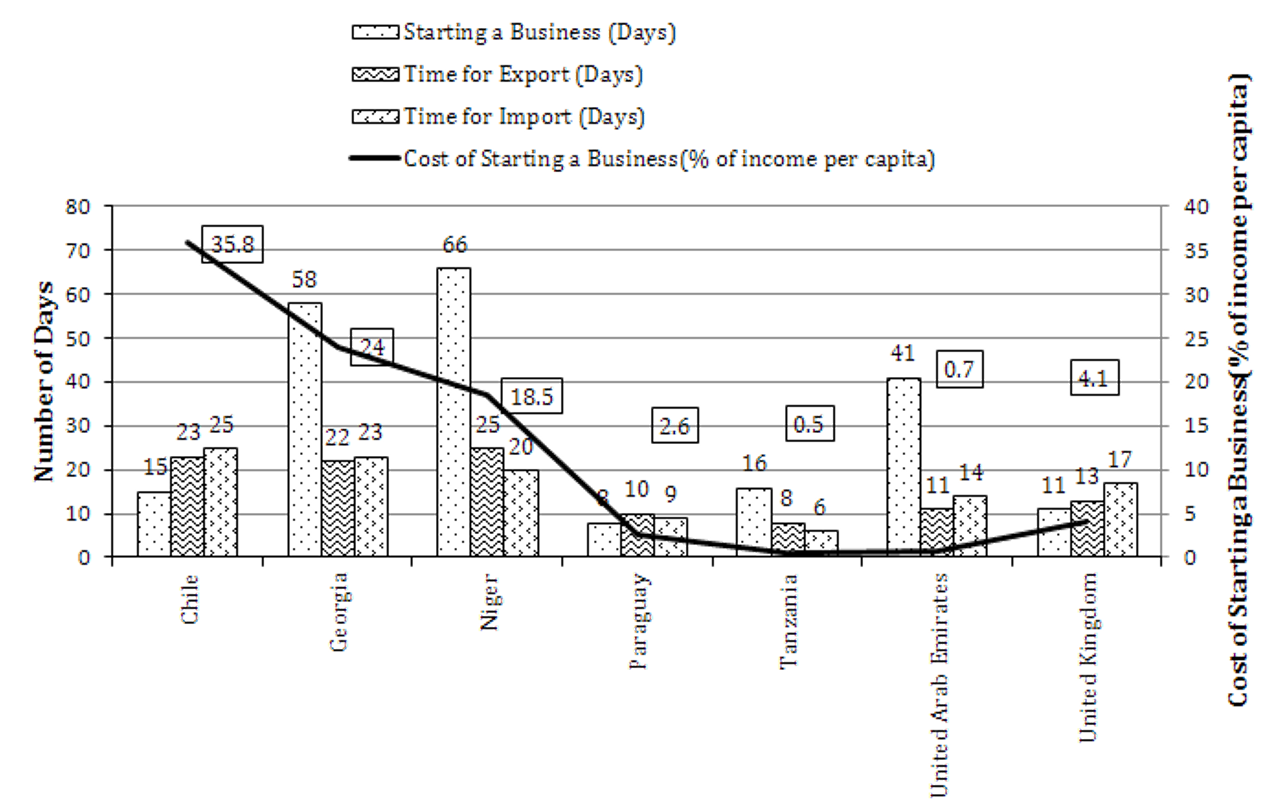
Given is information relating to cost of starting a business and number of days required for specific business activities in select countries. Answer the questions on the basis of the data in the following figure.
The data labels for the bars are placed above them, while the same for the line graph are placed in boxes. Legend for the bars is given in the order of left bar to the right bar.
If countries were ranked according to the number of days required to start a business, (with the country requiring least number of days being rank highest), which of the top three countries would have the least cost to per capita income ratio?
- A.
Chile
- B.
Tanzania
- C.
Paraguay
- D.
None of the above
Answer: Option C
Explanation :
The countries are ranked according to the number of days required to start a new business.
Hence, the top 3 countries, in ascending order, are Paraguay, United Kingdom, and Chile.
Among these, Paraguay has the least ratio of cost to per capita income (2.6).
Hence, option (c).
Workspace:
Ratio of number of days required for the export to import is the least for which country?
- A.
UK
- B.
UAE
- C.
Chile
- D.
Georgia
Answer: Option A
Explanation :
The ratio of export to import for each of the given countries is:
UK = = 0.76
UAE = = 0.786
Chile = = 0.92
Georgia = = 0.957
Thus, the least ratio is for UK.
Hence, option (a).
Workspace:
Identify the TRUE statement
- A.
In Tanzania, the number of days required for exporting is lower than the number of days required for importing.
- B.
The sum of number of days required for exporting and the number of days required for importing is the third lowest for UK.
- C.
In Paraguay, the number of days required for starting a business id higher than the number of days required for importing.
- D.
In Georgia, the number of days required for exporting is lower than the number of days required for importing.
Answer: Option D
Explanation :
Check the statements in options 1, 3 and 4 first as they require a comparison of only two quantities. The statement in option 1 is false as the number of days required for exporting in Tanzania (8) is more than the number of days required for importing (6). The statement in option 3 is false as the number of days required to start a business in Paraguay (8) is less than the number of days required for importing (9). The statement in option 4 is true as the number of days required for exporting in Georgia (22) is less than the number of days required for importing (23).
Hence, option (d).
Note:
There is no need to check option 2 once option 4 is proved to be true.
Workspace:
Identify the FALSE statement
- A.
The number of days required for starting a business in Chile is lower than the corresponding figure in Tanzania.
- B.
The number of days required for starting a business in UK is equal to number of days for exporting in UAE.
- C.
The number of days required for importing in Georgia is higher than the number of days required for exporting in Niger
- D.
The cost of starting a business as percentage of per capita income in Tanzania is lower than the corresponding figure in UAE.
Answer: Option C
Explanation :
It can be verified from the graph that the statements in options 1, 2 and 4 are true. The statement in option 3 is false as the number of days required for importing in Georgia (23) is less than the number of days required for exporting in Niger (25).
Hence, option (c).
Workspace:
Read the passage below and answer the questions that follow.
a. Six Indian professors from six different institutions (Jupiter, Mars, Mercury, Neptune, Pluto, Uranus) went to China to attend an international conference on “Sustainability and Innovation in Management: A Global Scenario” and they stayed in six successive rooms on the second floor of a hotel (201 _ 206).
b. Each of them has published papers in a number of journals and has donated to a number of institutions last year.
c. The professor in room no. 202 has published in twice as many journals as the professor who donated to 8 institutions last year.
d. The professor from Uranus and the Professor in room number 206 together published in a total of 40 journals.
e. The professor from Jupiter published in 8 journals less than the professor from Pluto but donated to 10 more institutions last year.
f. Four times the number of 4 journal publications by the professor in room number 204 is lesser than the number of institutions to which he donated last year.
g. The professor in room number 203 published in 12 journals and donated to 8 institutions last year.
h. The professor who published in 16 journals donated to 24 institutions last year.
i. The professor in room number 205 published in 8 journals and donated to 2 institutions less than the professor from Mercury last year. The Mercury professor is staying in an odd numbered room.
j. The Mars professor is staying two rooms ahead of Pluto professor who is staying two rooms ahead of the Mercury professor in ascending order of room numbers.
k. The professors from Mercury and Jupiter do not stay in room number 206.
In which room is the Mars professor staying?
- A.
Room number 201
- B.
Room number 203
- C.
Room number 205
- D.
None of the above
Answer: Option C
Explanation :
Denote the professors by their institution names.
From (j) : Mercury, Pluto, and Mars stay in 201, 203 ,205 or 202, 204, 206.
From (i) Mercury stays in an odd numbered room. Thus Mercury, Pluto, and Mars stay in 201, 203 and 205 respectively.
From (d) and (k), Neptune stays in 206.
From (g) Pluto published 12 journals and donated to 8 institutions.
From (e), Jupiter published 8 journals less than Pluto and donated to 10 more institutions. Therefore, Jupiter published 4 journals and donated to 18 institutions.
From(c) the professor from room 202 published 24 journals. Hence, he cannot be Jupiter. Therefore, Uranus stays in room 202 and Jupiter in 204.
From (d), Uranus and Neptune put together published 40 journals. So Neptune published 16 journals.
From (h), Neptune donated to 24 institutions.
From (i) Mars published 8 journals.
Thus, all the data can be shown as given in the table below.

Mars stays in room number 205
Hence, option (c).
Workspace:
How many institutions did the Jupiter professor donate to last year?
- A.
8
- B.
3
- C.
18
- D.
24
Answer: Option C
Explanation :
Denote the professors by their institution names.
From (j) : Mercury, Pluto, and Mars stay in 201, 203 ,205 or 202, 204, 206.
From (i) Mercury stays in an odd numbered room. Thus Mercury, Pluto, and Mars stay in 201, 203 and 205 respectively.
From (d) and (k), Neptune stays in 206.
From (g) Pluto published 12 journals and donated to 8 institutions.
From (e), Jupiter published 8 journals less than Pluto and donated to 10 more institutions. Therefore, Jupiter published 4 journals and donated to 18 institutions.
From(c) the professor from room 202 published 24 journals. Hence, he cannot be Jupiter. Therefore, Uranus stays in room 202 and Jupiter in 204.
From (d), Uranus and Neptune put together published 40 journals. So Neptune published 16 journals.
From (h), Neptune donated to 24 institutions.
From (i) Mars published 8 journals.
Thus, all the data can be shown as given in the table below.

Jupiter donated to 18 institutions.
Hence, option (c).
Workspace:
The professor of which institute is staying in room number 206?
- A.
Jupiter
- B.
Uranus
- C.
Mercury
- D.
Neptune
Answer: Option D
Explanation :
Denote the professors by their institution names.
From (j) : Mercury, Pluto, and Mars stay in 201, 203 ,205 or 202, 204, 206.
From (i) Mercury stays in an odd numbered room. Thus Mercury, Pluto, and Mars stay in 201, 203 and 205 respectively.
From (d) and (k), Neptune stays in 206.
From (g) Pluto published 12 journals and donated to 8 institutions.
From (e), Jupiter published 8 journals less than Pluto and donated to 10 more institutions. Therefore, Jupiter published 4 journals and donated to 18 institutions.
From(c) the professor from room 202 published 24 journals. Hence, he cannot be Jupiter. Therefore, Uranus stays in room 202 and Jupiter in 204.
From (d), Uranus and Neptune put together published 40 journals. So Neptune published 16 journals.
From (h), Neptune donated to 24 institutions.
From (i) Mars published 8 journals.
Thus, all the data can be shown as given in the table below.

The professor from Neptune is staying in room number 206.
Hence, option (d).
Workspace:
The professor of which institute donated to 24 institutions last year?
- A.
Jupiter
- B.
Uranus
- C.
Mercury
- D.
Neptune
Answer: Option D
Explanation :
Denote the professors by their institution names.
From (j) : Mercury, Pluto, and Mars stay in 201, 203 ,205 or 202, 204, 206.
From (i) Mercury stays in an odd numbered room. Thus Mercury, Pluto, and Mars stay in 201, 203 and 205 respectively.
From (d) and (k), Neptune stays in 206.
From (g) Pluto published 12 journals and donated to 8 institutions.
From (e), Jupiter published 8 journals less than Pluto and donated to 10 more institutions. Therefore, Jupiter published 4 journals and donated to 18 institutions.
From(c) the professor from room 202 published 24 journals. Hence, he cannot be Jupiter. Therefore, Uranus stays in room 202 and Jupiter in 204.
From (d), Uranus and Neptune put together published 40 journals. So Neptune published 16 journals.
From (h), Neptune donated to 24 institutions.
From (i) Mars published 8 journals.
Thus, all the data can be shown as given in the table below.

The professor from Neptune donated to 24 institutions
Hence, option (d).
Workspace:
The professor of which institute published in the maximum number of journals?
- A.
Jupiter
- B.
Uranus
- C.
Neptune
- D.
Mars
Answer: Option B
Explanation :
Denote the professors by their institution names.
From (j) : Mercury, Pluto, and Mars stay in 201, 203 ,205 or 202, 204, 206.
From (i) Mercury stays in an odd numbered room. Thus Mercury, Pluto, and Mars stay in 201, 203 and 205 respectively.
From (d) and (k), Neptune stays in 206.
From (g) Pluto published 12 journals and donated to 8 institutions.
From (e), Jupiter published 8 journals less than Pluto and donated to 10 more institutions. Therefore, Jupiter published 4 journals and donated to 18 institutions.
From(c) the professor from room 202 published 24 journals. Hence, he cannot be Jupiter. Therefore, Uranus stays in room 202 and Jupiter in 204.
From (d), Uranus and Neptune put together published 40 journals. So Neptune published 16 journals.
From (h), Neptune donated to 24 institutions.
From (i) Mars published 8 journals.
Thus, all the data can be shown as given in the table below.

The professor from Uranus published maximum number of journals.
Hence, option (b).
Workspace:
In how many journals did the Jupiter professor publish?
- A.
8
- B.
4
- C.
12
- D.
20
Answer: Option B
Explanation :
Denote the professors by their institution names.
From (j) : Mercury, Pluto, and Mars stay in 201, 203 ,205 or 202, 204, 206.
From (i) Mercury stays in an odd numbered room. Thus Mercury, Pluto, and Mars stay in 201, 203 and 205 respectively.
From (d) and (k), Neptune stays in 206.
From (g) Pluto published 12 journals and donated to 8 institutions.
From (e), Jupiter published 8 journals less than Pluto and donated to 10 more institutions. Therefore, Jupiter published 4 journals and donated to 18 institutions.
From(c) the professor from room 202 published 24 journals. Hence, he cannot be Jupiter. Therefore, Uranus stays in room 202 and Jupiter in 204.
From (d), Uranus and Neptune put together published 40 journals. So Neptune published 16 journals.
From (h), Neptune donated to 24 institutions.
From (i) Mars published 8 journals.
Thus, all the data can be shown as given in the table below.

The professor from Jupiter published in 4 journals.
Hence, option (b).
Workspace:
Answer the following question based on the information given below.

i. If the first letter is a vowel and last letter is a consonant, both are to be coded as ©
ii. If the first letter is a consonant and last letter is a vowel, both are to be coded as 0
iii. If the first letter as well as the last letter are vowels, both are to be coded as the code of the last letter.
N F R S C A
- A.
753
- B.
053$
- C.
0232%0
- D.
053
Answer: Option D
Explanation :
Since the first letter is a consonant (N) and the last letter is a vowel (A), both N and A will be coded as 0.
Thus, NFRSCA is coded as 053%20.
Hence, option (d).
Workspace:
A R F T H E
- A.
58#%
- B.
4358#%
- C.
4358#4
- D.
85#%
Answer: Option A
Explanation :
Since the first and last letters are both vowels (A and E), they are coded as %.
Thus, ARFTHE is coded as %358#%.
Hence, option (a).
Workspace:
Read the following information to answer the question that follows.
P – Q means Q is father of P
P × Q means Q is brother of P
P ÷ Q means Q is wife of P
P + Q means Q is sister of P
Which of the following means M is the grandfather of T?
- A.
T – C ÷ L + N × M
- B.
T – R ÷ Z + L × M
- C.
T ÷ Z × L + F – M
- D.
None of these
Answer: Option D
Explanation :
Option 1:
M is the brother of N, who is the sister of L So, M is also the brother of L. L is the wife of C who is the father of T. Thus, M cannot be the grandfather of T.
Option 2:
M and T are at the same position in option 2 as in 1. Also, since the symbols and their position in option 2 is the same as that in option 1, the relation between the two is also the same.
Option 3:
M is the father of F who is the sister of L. L is the brother of Z. Thus, M is the father of F, L and Z. Z is the wife of T. Thus M cannot be the grandfather of T.
Thus, none of the given options means M is the grandfather of T.
Hence, option (d).
Alternatively,
Except for the ‘−’ sign, all the other signs convey a relationship in the same generation. For M to be the grandfather of T, there should be two ‘−’ signs. This is not present in any of the options.
Hence, option (d).
Workspace:
There are five houses P, Q, R, S, and T. P is right of Q and T is left of R and right of P. Q is right of S. Which is in the middle?
- A.
P
- B.
Q
- C.
T
- D.
R
Answer: Option A
Explanation :
T is to the left of R and to the right of P
P T R
P is to the right of Q and Q is to the right of S.
S Q P T R
Thus, P is in the middle.
Hence, option (a).
Workspace:
Find the statement which is necessarily true according to the given information:
The Asatra Vriksh is an evergreen tree that grows in the Nilgiris. The Asatra Vriksh has a fleshy, poisonous fruit. Recently, Purol, a substance found in the bark of the Asatra Vriksh, was discovered to be a promising new antidepressant drug.
- A.
Purol is poisonous when taken by healthy people.
- B.
Purol has cured people from various diseases.
- C.
People should not eat the fruit of Asatra Vriksh.
- D.
No treatment for depression was known till Purol was discovered.
Answer: Option C
Explanation :
Option 1 is incorrect as the passage clearly mentions that the fruit of the tree is poisonous not Purol.
According to the passage, Purol only has anti-depressant properties. This eliminates option 2.
According to the passage, Purol is a “promising new drug”. This indicates that drugs treating depression existed prior to the discovery of Purol. This eliminates option 4.
Option 3 is necessarily true as according to the passage, “The Asatra Vriksha has a fleshy, poisonous fruit”.
Hence, the correct answer is option 3.
Workspace:
Given below are some words from an artificial language.
agnoscrenia means poisonous spider
delanocrenia means poisonous snake
agnosdeery means brown spider
Which of the following is most likely to mean “black widow spider”?
- A.
aeeryclostangus
- B.
agnosvitriblunin
- C.
agnosdelano
- D.
trymuttiangus
Answer: Option B
Explanation :
agnoscrenia means poisonous spider and agnosdeery means brown spider. Thus, the common term between them is agnos, which means spider.
Thus, options 1 and 4 are eliminated.
Agnoscrenia means poisonous spider and delanocrenia means poisonous snake. Thus, the common term between them is crenia, meaning poisonous.
Therefore, delano means snake.
Hence, option (c) is also eliminated.
Therefore, black widow spider can mean agnosvitriblunin.
Hence, option (b).
Workspace:
A research study recorded that the number of unemployed educated youth was equal to the number of unemployed uneducated youth. It was concluded by the researchers that being educated does not enhance the probability of being employed.
Which of the following information would be required to validate the above conclusion?
- A.
The number unemployed educated and uneducated people in other age groups.
- B.
The number of organisations employing youth.
- C.
The percentage of unemployment in educated youth versus percentage of unemployment in uneducated youth.
- D.
The percentage increase in number of educated youth versus last year.
Answer: Option C
Explanation :
The passage is a comparison between the raw data resulting from a study. There were as many unemployed educated youth as unemployed uneducated youth. The conclusion being that education provided no guarantee in securing employment.
Option 1 is incorrect because these numbers are not really comparable as this data would not be able to either support or disqualify the findings of the study as option 1 does not pertain to youths.
Option 2 is incorrect as just this information would not suffice to prove the study findings.
Option 4 is incorrect because it only considers the increased number of educated youth. This is not complete information to support the study findings.
Option 3 is correct because the percentage figures would provide comparative data to validate the conclusion mentioned in the passage.
Hence, the correct answer is option 3.
Workspace:
Study the information below and answer the questions based on it:i. There are 5 persons in a group – P, Q, R, S and T.
ii. In this group, there is one badminton player, one chess player and one tennis player.
iii. P and S are unmarried ladies who do not play any games.
iv. No lady is either a chess player or a badminton player.
v. There is one married couple in this group of which T is the husband.
vi. Q is the brother of R and is neither a chess player nor a tennis player.
Which of the following groups has only ladies?
- A.
PQR
- B.
QRS
- C.
RST
- D.
None of the above
Answer: Option D
Explanation :
P and S are unmarried females. There is one couple and T is the husband. Also, Q is the brother of R. Thus, R has to be the wife of T. Neither among the options 1, 2, & 3 is a group of ladies.
Hence, option (d).
Workspace:
Who is the tennis player?
- A.
Q
- B.
R
- C.
S
- D.
T
Answer: Option B
Explanation :
Consider the solution to the first question. P and S are ladies and they don’t play any game. No lady is either a chess player or a badminton player. Since R is the third lady, she is the tennis player.
Hence, option (b).
Workspace:
Who is the wife of T?
- A.
P
- B.
S
- C.
Q
- D.
R
Answer: Option D
Explanation :
Consider the solution to the first question. R is the wife of T.
Hence, option (d).
Workspace:
The time in a clock is 20 minutes past 2. Find the angle between the hands of the clock.
- A.
45 degrees
- B.
50 degrees
- C.
60 degrees
- D.
120 degrees
Answer: Option B
Explanation :
Angle between 2 & 4 at the centre is 60⁰. In 20 minutes, the hour hand moves 10⁰. Thus, angle between the two hands at 2 hrs. 20 minutes would be
60 – 10 = 50⁰.
Hence, option (b).
Workspace:
Select the correct option to fill in the blank space/s
c_bba_cab_ac_ab_ac
- A.
b, c, b, a, c
- B.
c, a, b, c, b
- C.
a, c, c, b, c
- D.
a, c, b, c, b
Answer: Option D
Explanation :
Substitute the options into the blanks and try to find whether a sequence is formed. The sequence ‘cabbac’ repeats itself.
Hence, option (d).
Workspace:
Select the correct option to fill in the blank space/s
B2CD, _____, BCD4, _____, BC6D
- A.
BC3D; B5CD
- B.
BC2D; BC3D
- C.
BC3D; B3CD
- D.
BC3D; BC5D
Answer: Option A
Explanation :
The subscript in the terms follows the pattern: 2 _ 4 _ 6.
Hence, the subscript in the missing terms is 3 and 5 respectively.
Also, the position of the subscript follows the pattern B _ D _ C. Hence, it should be with the letters C and B respectively in the missing terms.
Hence, option (a).
Workspace:
Select the correct option to fill in the blank space/s
P3, M8, ____, G24, D35
- A.
K15
- B.
J13
- C.
I13
- D.
J15
Answer: Option D
Explanation :
There is a gap of two letters between the given letters. Thus, the letter to be filled in the blank space would be ‘J’. Second difference between the numbers is common. Therefore, the number would be 8 + 7 = 15.
Hence, option (d).
Workspace:
Feedback
Help us build a Free and Comprehensive Preparation portal for various competitive exams by providing us your valuable feedback about Apti4All and how it can be improved.
 Solution
 Discuss
 Report