CRE 2 - Bar Graphs | DI - Tables & Graphs
Join our Telegram Channel for CAT/MBA Preparation.
Answer the next 3 questions based on the information given below:
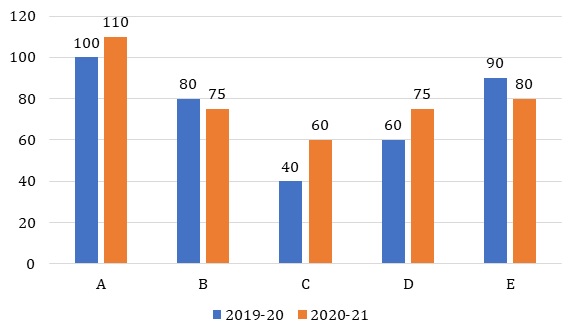
Graph below shows sales (in crores) of 5 different products of a company in 2019-20 and 2020-21.

What is the average sale for each product of the company during 2019-20 (in crores)?
Answer: 74
Workspace:
From 2019-20 to 2020-21, for which product is the percent growth highest.
- (a)
A
- (b)
B
- (c)
C
- (d)
D
Answer: Option C
Workspace:
What is the % change in total sales of company from 2019-20 to 2020-21.
- (a)
7.77%
- (b)
9.37%
- (c)
8.11%
- (d)
None of these
Answer: Option C
Workspace:
Answer the next 3 questions based on the information given below:
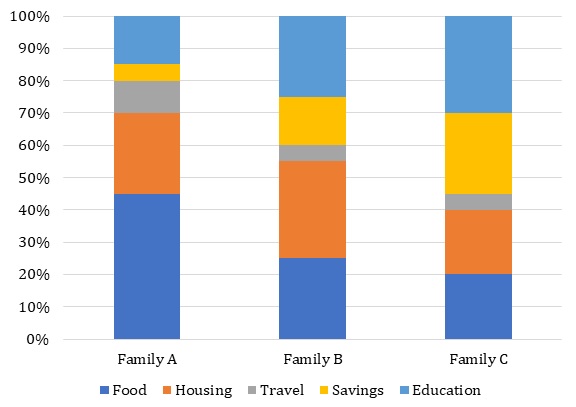
Annual incomes of family A, B and C are Rs. 40,000, Rs. 1,00,000 and Rs. 2,00,000 respectively. The following chart shows percent breakup of expenditure of each of these families.

What percent of their total income did the 3 families together spend on travel?
- (a)
5.59%
- (b)
6.66%
- (c)
6%
- (d)
None of these
Answer: Option A
Workspace:
What percent of family C’s expenditure went for housing?
- (a)
25%
- (b)
30%
- (c)
26.67%
- (d)
33.33%
- (e)
50%
Answer: Option C
Workspace:
How does the food bill for family A compare with the food bill for family C?
- (a)
Family A spent twice as much on food as did family C.
- (b)
Family A and C spend the same amount on food.
- (c)
Family C spend 4 times on food as did family A.
- (d)
Family C spent approximately 2.2 times on food as did family A.
Answer: Option D
Workspace:
Answer the next 4 questions based on the information given below:
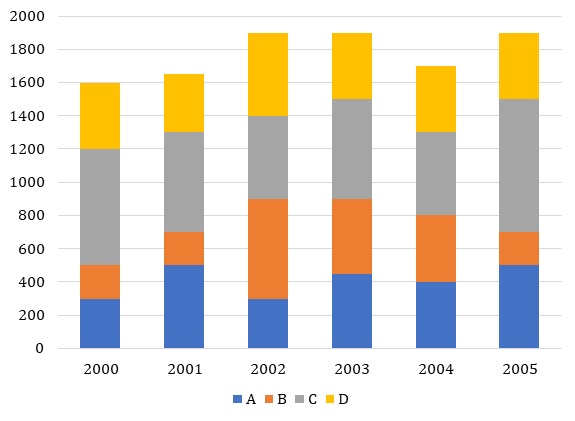
The bar graph below shows the sales of mobiles by four different companies (in thousands of units) from 2000-05.
Sales Revenue = Sales (by volume) × Selling Price of each unit
Profit = Sales Revenue – Expenditure
Profit Percentage = (Sales - Expenditure)/Expenditure × 100

Which mobile company had the highest average annual sales (by volume)?
- (a)
D
- (b)
B
- (c)
A
- (d)
C
Answer: Option D
Workspace:
The market share of a company is defined as the sales of the company as a percentage of the total sales (by volume) of all the companies in the market. If these are the only four companies in the mobile market over the entire period, in which year was the market share of B the highest?
- (a)
2000
- (b)
2003
- (c)
2002
- (d)
2005
Answer: Option C
Workspace:
In the year 2000, the expenditures of D, B, A & C were in the ratio 3 : 7 : 1 : 2. Which company had the highest profit percentage? (Assume all companies made profit)
- (a)
B
- (b)
C
- (c)
A
- (d)
Cannot be determined
Answer: Option D
Workspace:
In 2004, the profit percentage obtained by A on selling each mobile was 30, and each mobile was sold for Rs. 195, then what was the expenditure incurred by A in 2004? (Assume all mobiles produced by A in 2004 were sold)
- (a)
Rs. 8 crore
- (b)
Rs. 6 crore
- (c)
Rs. 4.5 crore
- (d)
Rs. 5 crore
Answer: Option B
Workspace:
Answer the next 4 questions based on the information given below:
The following table shows the prices (per kg) of Tomato, Onions, Potato and Cornflour which are used in the making of different dishes at a restaurant for six days. Each day the cook changes the relative quantity of ingredients in the dish so as to produce a different taste. These are the only four components in the making of each dish.

If a dish is to contain at least 50% Potato (by weight) and at least 10% (by weight) of each of the other three items, then what is the minimum cost of making one kg of the dish on day 3?
- (a)
38.9
- (b)
35
- (c)
32.5
- (d)
None of the above
Answer: Option A
Workspace:
If in one kg of the dish, the quantity by weight of Tomato, Onions, Potato and Corn-Flour is 200 gm, 150 gm, 250 gm and 400 gm on day 1 and 100 gm, 225 gm, 175 gm and 500 gm on day 4, then what is the increase in the cost of making 1 kg of the dish on day 4, when compared to day 1 (in paisa)?
Answer: 1090
Workspace:
If the quantity of all the four items used in the dish remain the same in weeks 1 and 3, then what is the percentage increase in the cost of making 1 kg of the dish on day 4, when compared to day 2?
- (a)
21.6%
- (b)
20.8%
- (c)
20.5%
- (d)
Cannot be determined
Answer: Option D
Workspace:
If none of the quantities can exceed 40% (by weight) what would be the maximum cost of making 1 kg of the dish in any of the given days?
- (a)
44
- (b)
48.3
- (c)
45.2
- (d)
49
Answer: Option D
Workspace:
Answer the next 4 questions based on the information given below:
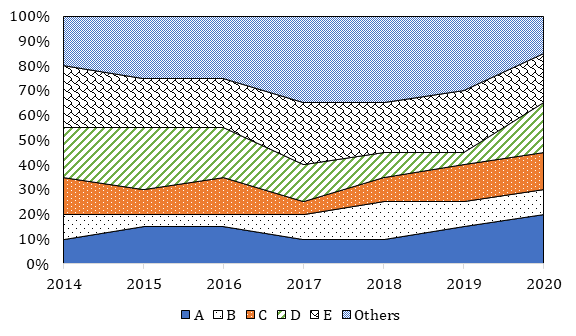
The graph below given the percentage break-up of number of mobile phones used in a country from 2014 till 2020 of different companies. The total number of mobile phones used increases by 20% every year from 2014 till 2020.

What is the percentage increase in the number of mobile phones in the country from 2016 to 2019?
- (a)
44%
- (b)
72.8%
- (c)
87.5%
- (d)
None of these
Answer: Option B
Workspace:
What is the ratio of mobiles of company A and that of company B in 2014?
- (a)
1 : 2
- (b)
2 : 3
- (c)
3 : 4
- (d)
4 : 5
Answer: Option A
Workspace:
Not considering others, which company had the maximum increase in the number of mobile phones used from one year to the next?
- (a)
A
- (b)
C
- (c)
D
- (d)
E
Answer: Option C
Workspace:
Feedback
Help us build a Free and Comprehensive Preparation portal for various competitive exams by providing us your valuable feedback about Apti4All and how it can be improved.
 Solution
 Discuss
 Report