Tables & Graphs - SSC
The number of cars passing the road near a colony from 6 am to 12 noon has been shown in the following histogram.
During which hour(s) is the number of cars passed more than the average number of cars passed from 6 am to 11 am?
.png)
- A.
8- 9 am, 9- 10 am
- B.
8- 9 am
- C.
7- 8 am, 8- 9 am, 9--10 am, 10-11 am
- D.
7- 8 am, 8- 9 am, 9--10 am
Answer: Option D
Explanation :
Workspace:
The given bar graph shows the sales of computers from six dealers A, B, C, D, E and F, during two consecutive years 2015 and 2016. Study the graph and answer the question that follows.
.png)
What is the ratio of the total sales from dealers A, B and C taken together for the year 2015 to the sales from dealers D, E and F taken together for die year 2016?
- A.
25 : 39
- B.
37 : 21
- C.
21 : 37
- D.
39 : 25
Answer: Option C
Explanation :
Workspace:
The following pie chart shows the distribution of percentage of a certain corporate office employees in various age-groups.
Total number of employees of the corporate office = 2500
Study the chart carefully and answer the question that follow.
.png)
What is the central angle (in degrees) corresponding to the age groups 38+ to 48 years and 58+ years and above, taken together?
- A.
36
- B.
144
- C.
120
- D.
108
Answer: Option B
Explanation :
Workspace:
The given histogram shows the heights of 232 students of an athletic club and their numbers. Study the histogram carefully and answer the questions that follows.
.png)
What is the average height (in cm) of 32 tallest students of the athletic club?
Express your answer correct to one place of decimal.
- A.
166.4
- B.
167.4
- C.
165.4
- D.
164.4
Answer: Option D
Explanation :
Workspace:
The following bar graph shows the total number of youth (in lakhs) and the nmnber of employed youth (in lakhs) in 5 states A, B, C, D and E.
How many youth (in lakhs) are unemployed in states A and C taken together?
.png)
- A.
2.25
- B.
2.8
- C.
3
- D.
2.85
Answer: Option C
Explanation :
Workspace:
Study the given pie chart and answer the question that follows.
The pie chart represents the percentage-wise distribution of the total number of Vanilla cakes and Chocolate cakes sold every day in a week. The total number of cakes sold in a week = 10500.
.png)
The ratio of the number of Vanilla cakes sold to the number of Chocolate cakes sold on Saturday is 4: 3. the selling price of one Vanilla cake is ₹8 and that of one Chocolate cake is ₹15, then the total amount earned (in ₹) by selling all Vanilla cakes and Chocolate cakes on Saturday is:
- A.
18,480
- B.
14,880
- C.
20,000
- D.
10,488
Answer: Option A
Explanation :
Workspace:
The following bar graph shows the total number of youth (in lakhs) and the number of employed youth (in lakhs) in 5 states A, B, C, D and E.
The number of employed youth in state B is what percentage of the number of employed youth in state E?
.png)
- A.
87%
- B.
87.5%
- C.
88.5%
- D.
85%
Answer: Option B
Explanation :
Workspace:
The given histogram represents the marks of students in Mathematics test of a certain class.
The total number of students is 350 and the maximum marks of the test are 200. Study the graph and answer the question that follows.
.png)
What is the class average ( correct up to one place of decimal) of mathematics test?
- A.
119.3
- B.
123.7
- C.
115.8
- D.
127.3
Answer: Option A
Explanation :
Workspace:
The following bar graph shows the number of youth (in lakhs) and the number of employed youth (in lakhs) in 5 states A, B, C, D and E.
In which state(s) is the number of youth more than the average number of youth in the five states?
.png)
- A.
A
- B.
A, C
- C.
A, C, D, E
- D.
A, C, D
Answer: Option A
Explanation :
Workspace:
The breakup of the total number of employees of a company working in different offices (A to E). in degrees, is given in the pie chart.
Total number of employees = 2400.
.png)
In which office is the number of employees 600?
- A.
E
- B.
A
- C.
C
- D.
D
Answer: Option D
Explanation :
Workspace:
The following bar chart shows the number of students enrolled in two Summer Camps A and B from 2014 to 2019.
Study the chart carefully and answer the question that follows.
.png)
The number of students enrolled in Camp A in 2016 and 2019 together is what percentage of the number of students enrolled in Camp B in 2015 and 2017 together?
- A.
64%
- B.
75%
- C.
60%
- D.
80%
Answer: Option A
Explanation :
Workspace:
Study the given bar graph and answer the question that follows.
The bar graph shows the exports of cars of type A and B (in ₹ millions) from 2014 to 2018.
.png)
In which year were the exports of cars of type A ₹55 million less than the average exports (per year) of cars of type B over the five years?
- A.
2015
- B.
2014
- C.
2017
- D.
2016
Answer: Option B
Explanation :
Workspace:
The given bar graph shows exports of cars of type A and B (in₹ millions) from 2014 to 2018. Study the graph and answer the question that follows.
Exports of Cars of Type A and B (in ₹ millions) from 2014-2018.
.png)
The total exports of cars of type B in 2014 to 2017 is what per cent more than the total exports of cars of type A in 2015 to 2018?
(Correct to one decimal place).
- A.
5.6%
- B.
4.9%
- C.
6.5%
- D.
7.2%
Answer: Option A
Explanation :
Workspace:
The given histogram shows the daily wages (in ₹) of workers in a factory.
Study the histogram and answer the question that follows.
.png)
The number of workers with daily wages less than ₹180 is what percentage of the number of workers with daily wages more than ₹190? Express your answer correct to one decimal place.
- A.
85.6%
- B.
86.7%
- C.
75.8%
- D.
74.8%
Answer: Option D
Explanation :
Workspace:
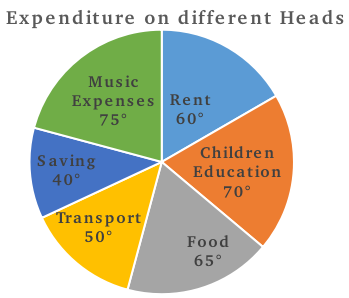
Monthly expenditure of a family on different heads is shown in the following pie chart. The family earns ₹10,08,000 every month.
The money ( in ₹) spent on Misc. Expenses is how much more than that spent on Children Education?
.png)
- A.
1,800
- B.
1,350
- C.
1,500
- D.
1,200
Answer: Option C
Explanation :
Workspace:
Monthly expenditure of a family on different heads is shown in the following pie chart. The family earns ₹1,08,000 every month.
What is the amount spent on Rent every month (in ₹)?

- A.
17,500
- B.
18,000
- C.
21,000
- D.
15,000
Answer: Option B
Explanation :
Workspace:
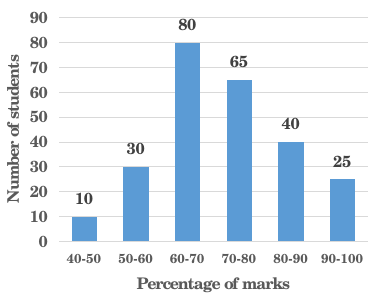
Study the histogram and answer the question given below.
The graph represents the number of students obtaining a percentage of marks in class X Board examination in 2018 in a
school.

The number of students who have secured less than 60% marks is what per cent less than the number of students who have
secured 80% marks and above?
- A.
37.4%
- B.
33.5%
- C.
38.5%
- D.
29.7%
Answer: Option C
Explanation :
Workspace:
The following bar graph shows exports of cars of type A and B (in ₹ millions) from 2014 to 2018. Study the graph and answer the question that follows.
Exports of Cars of Type A and B (in ₹ millions) during 2014 to 2018.

The total exports of cars of type A in 2014 to 2018 is what per cent more than the total exports of cars of type B in 2015 to 2017? (Correct to one decimal place)
- A.
44.3%
- B.
51.7%
- C.
50.4%
- D.
41.3%
Answer: Option B
Explanation :
Workspace:
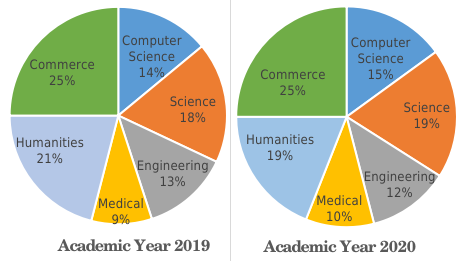
The following pie charts show the number of students studying in different departments of an institute during the academic years 2019 and 2020. The total number of students was 2000 and 2400, respectively, in academic years 2019 and 2020.
What is the ratio of Commerce and Computer Science students taken together in 2019 to Engineering and Medical students taken together in 2020?

- A.
65 : 44
- B.
22 : 39
- C.
44 : 65
- D.
39 : 22
Answer: Option A
Explanation :
Workspace:
The following bar graph shows the number of youth (in lakhs) and the number of employed youth (in lakhs) in five states A, B, C, D and E. what is the average number of youth in the five states?
.png)
- A.
1200000
- B.
1025000
- C.
1015000
- D.
1010000
Answer: Option D
Explanation :
Workspace:
The given bar graph shows the income and expenditure (in crores ₹) of a company over 5 years, from 2014 to 2018.
Study the bar graph and answer the question that follows.
.png)
What is the difference (in crores ₹) between the expenditure for the years 2017 and 2018 taken together and the income for the years 2015 and 2016 taken together?
- A.
15
- B.
16
- C.
18
- D.
20
Answer: Option D
Explanation :
Workspace:
Performance of 1800 students in grades has been shown in the following pie chart. How many more students have obtained grade B than those who have obtained grade C?
.png)
- A.
54
- B.
3
- C.
60
- D.
50
Answer: Option A
Explanation :
Workspace:
The number of cars passing the road near a colony from 6 am to 12 noon has been shown in the following histogram. During which hour(s) is the number of cars passed less than the average number of cars passed from 7 am to 12 noon?
.png)
- A.
7- 8, 8-9 9-10
- B.
6-7, 11-12
- C.
6-7, 10-11, 11-12
- D.
0-11, 11-12
Answer: Option C
Explanation :
Workspace:
In a school of 200 students, the following chart represents the percentage of students involved in different sports.
.png)
What is the number of students playing cricket?
- A.
17
- B.
83
- C.
24
- D.
34
Answer: Option D
Explanation :
The required number of students = 17% of 200 = 17/100 × 200 = 34.
Hence, option (d).
Workspace:
The table below shows the number of cakes sold by six different bakeries in a town on five different days of particular week.
.png)
What is the total number of cakes sold by the bakery D on Monday, Thursday and Sunday, taken together?
- A.
779
- B.
668
- C.
530
- D.
686
Answer: Option D
Explanation :
Required sum = 221 + 185 + 280 = 686.
Hence, option (d).
Workspace:
 View Answer